ANALYTICS
A PREDICTIVE MODEL OF NORTHWEST ACCIDENTS BY RISK.
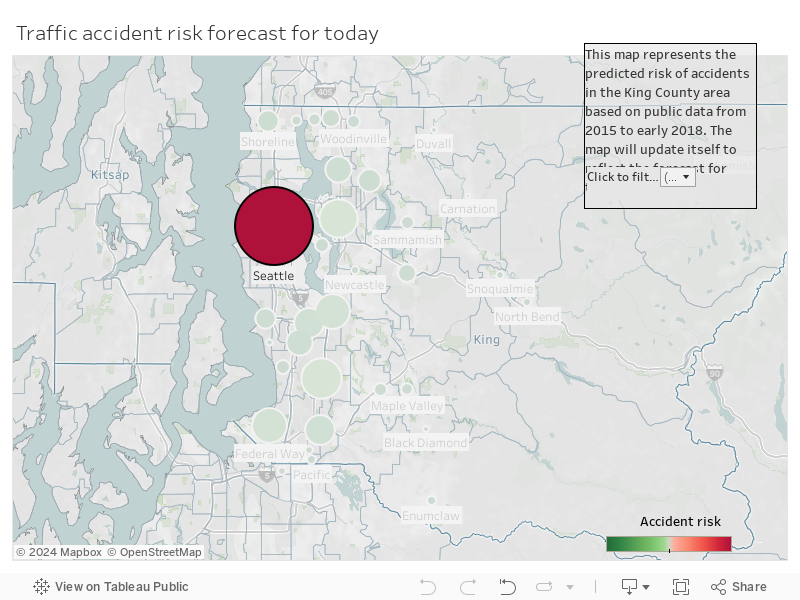
“YURCHAK’S DAILY RISK MAP.”
After the WSDOT delivered the northwest collisions for 2015 through June 2018 we parsed the dataset grouping by city and date, we then used Alteryx to forecast by week accidents after which we use Python use a weight for each day by which we then feed into Tableau for visualization. The result is a map of our area that uses the current day to present locations which have been historically and forecasted to be probable for collisions.
The code and dataset may be accessed here on our public Github account or simply http://bit.ly/2mbrkwY. The code consists of three scripts. The first one, “wsdot_parser.py”, will open the WSDOT dataset. Please note that the code assumes that the dataset will be on the same folder level and named “king.csv”. This script will generate two derived datasets: “weekday_coeffs.csv” and “weekly_table.csv”.
The first is a table where the general probability of an accident per city and weekday (Monday-Sunday) is represented by a number (0 to 1). The second one is the aggregate accidents per week over the full dataset grouped by city. Each row represents a week and it just counts the number of accidents that happened on that week at that city.
To do the actual forecast Alteryx Designed is required. The script provided (“arima_iter.yxmc”) will produce a forecast of accidents for the selected city (you must manually choose it in the Alteryx interface). This forecast is per week and each row represents a week for that city and is the result of an ARIMA model fit to the whole dataset per city and week.
Once all the cities have a forecast then the Python script “merger.py” will produce the final forecast for the next 16 weeks starting on the last date found on the WSDOT dataset. The general forecast for a week is spread between the days of that week, weighting each day by the weekday coefficient previously computed. At the end, the file “full_forecast.csv” is produced as the final output. This file can feed Tableau to create a visualization.
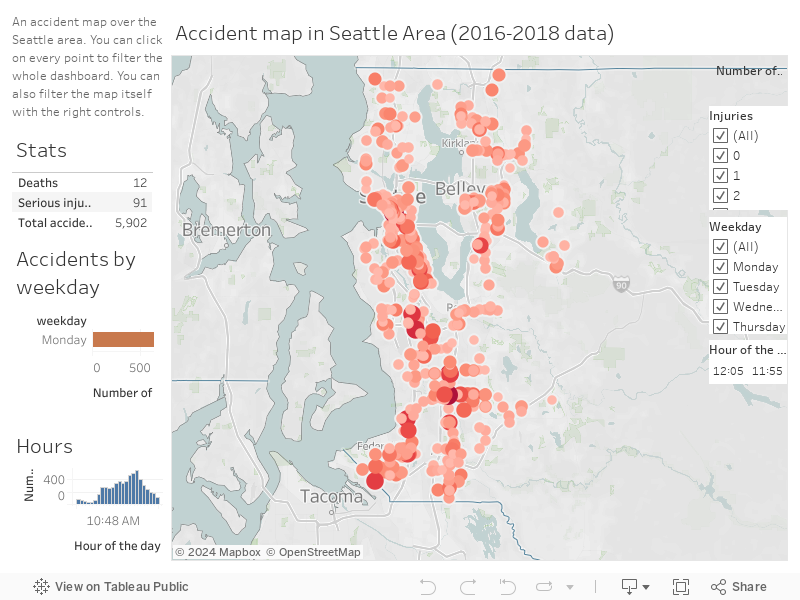
YURCHAK DAILY RISK MAP
SERIOUS TO FATAL ACCIDENTS IN THE NORTHWEST ANALYTICS PROCESSED BY OUR STAFF.
To better understand our Pacific Northwest clients we processed the WSDOT’s data on serious to fatal accidents. We processed all the WSDOT collisions and mapped them to the nearest intersections, ranked, color-coded our 500 top dangerous intersections and displayed them below. Presented here through this visualization is the frequency of accidents by date and time. Through analytics, we hope to better understand our clients and the conditions we all may find ourselves in.